Why 2026 Email Authentication Numbers Don’t Agree

Quick Answer
2026 email authentication statistics vary because studies measure different domain populations, sampling methods, and DMARC policies. Understanding SPF, DKIM, DMARC adoption, and enforcement benchmarks helps organizations assess their actual email security posture.
Executive takeaway
DMARC adoption can look low or high without either benchmark being wrong. Studies count different populations and measure different milestones, from record publication to requested enforcement. Choose benchmarks that match your domains, and preserve each percentage’s denominator and definition. Track record validity, enforcement, reporting, and legitimate-message authentication separately. Inbox placement remains a separate outcome, not evidence that DMARC caused an improvement. Sampling differences explain many apparent contradictions, but attribution errors and unresolved reporting dates still require verification.
How can DMARC adoption be both 30% and nearly 80%?
DMARC adoption can be 30.4% in one study and 79.4% in another without contradiction. The first figure covers roughly 5.5 million listed domains; the second covers 500 large companies’ primary domains.
The DMARCguard study examines domains drawn from the complete Tranco Top Sites list, not confirmed active email senders. Its 30.4% headline measures DMARC record presence across that scanned population.
The SimpleDMARC analysis examines the primary organizational domains of Fortune Global 500 companies. Its 79.4% result describes that enterprise sample, not every domain those companies own.
The useful question is therefore not which headline is right. It is which measurement helps assess your own authentication posture. Answering requires knowing who was counted, how researchers tested them, and what qualified as adoption.
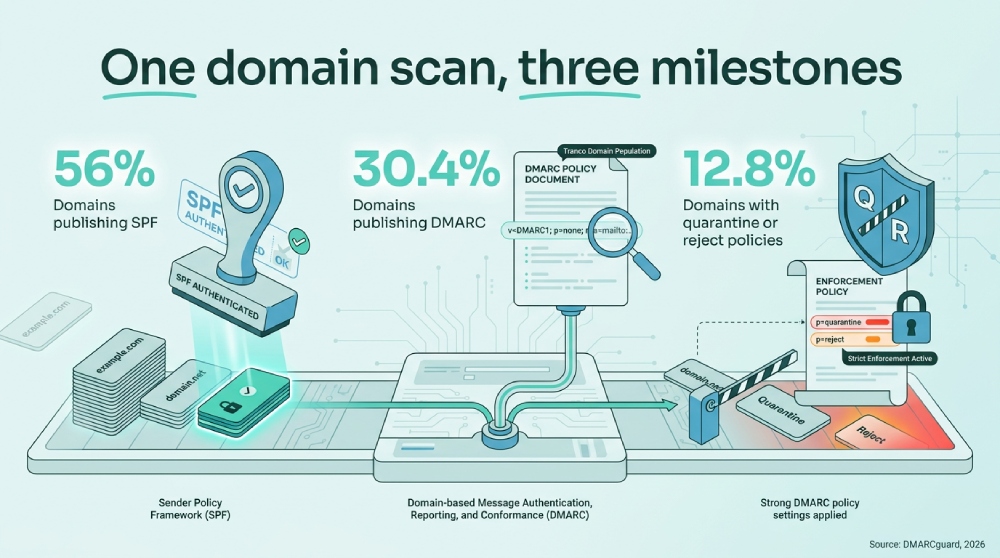
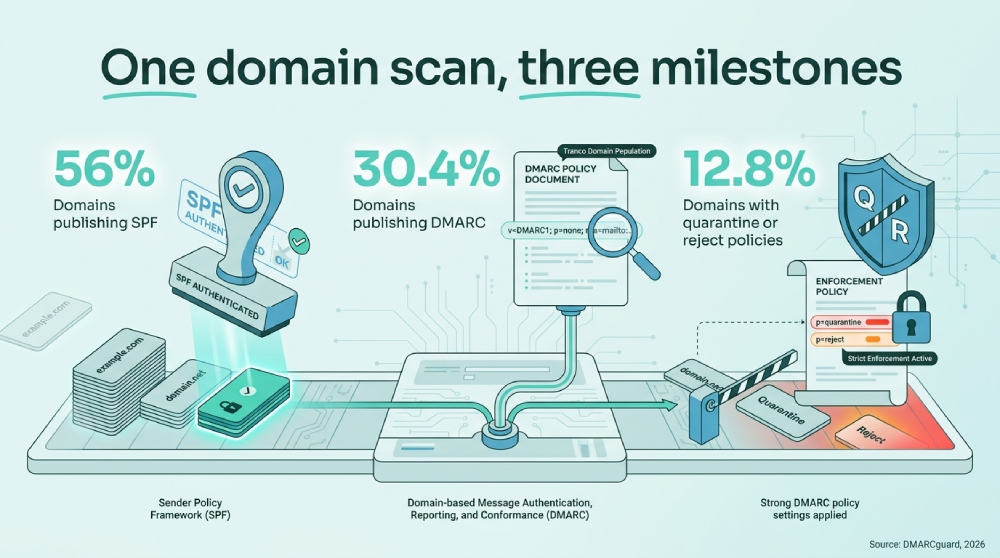
Even within one population, authentication measures answer different questions. The infographic compares three DMARCguard findings: 56.0% SPF presence, 30.4% DMARC presence, and 12.8% DMARC enforcement. These are separate measures within the same sample, not competing estimates of one outcome.
SPF identifies servers authorized to send mail for a domain. DMARC connects authentication to the visible sender identity and publishes a policy for authentication failures. Publishing a record is not equivalent to requesting quarantine or rejection.
DMARCguard’s 12.8% enforcement figure uses the scanned domain population as its denominator—the group being counted. It does not mean that only 12.8% of domains with DMARC request enforcement. SimpleDMARC likewise separates record presence from enforcement: 79.4% of primary domains publish DMARC, while 63% request quarantine or rejection.
Neither comparison explains why deployment differs. Population composition and scope vary, so the contrast cannot establish that company size causes stronger protection. Nor does the broad Tranco scan establish a universal internet adoption rate.
This article separates three questions that headlines often compress:
- Population: Were researchers counting listed domains, selected organizations, or tested senders?
- Method: Did they inspect records, test sending configurations, or observe messages?
- Definition: Did adoption mean record presence, requested enforcement, or enforcement combined with reporting?
These distinctions make benchmarks useful without making them interchangeable. They do not explain every discrepancy: a misattributed percentage still requires correction, not a sampling-based explanation.
Source: DMARCguard, 2026
Meet the five benchmarks behind the headlines
The five benchmarks describe distinct populations, not competing estimates of universal adoption. Their value depends on their sampling scope, collection method, and exclusions. The descriptions below follow the supplied research summaries rather than independently inspected study text.
DMARCguard: 30.4% across 5,499,028 domains. Its February 2026 authentication study scanned domains drawn from the complete Tranco Top Sites list. Researchers inspected DNS, the public system that stores domain configuration records.
The supplied account describes a population including parked, brochure-only, and infrastructure domains. This makes it a website-list-based benchmark rather than a sender-only panel. Its scale provides extensive coverage of the chosen list, but sample size does not remove selection bias. A popular-sites list is neither a random sample of registered domains nor a census of email senders.
SpamCipher: 47.2% of resolvable top-million domains. The Email Authentication at Scale preprint combines a systematic review with an active Tranco top-million scan. The supplied account places this measurement in mid-2026 and specifies that non-resolvable domains were excluded.
This higher-ranked population differs from DMARCguard’s broader list. Collection dates and DNS handling also warrant comparison, but the evidence does not isolate their contributions to the gap. SpamCipher’s reported agreement with OpenINTEL observations offers a cross-check, not proof of representativeness. Its findings should retain the qualification preprint.
Unspam: 48% of tested sending domains. The 2026 Email Deliverability Report examines domains sending test mail into a multi-provider panel. It reports domain-level authentication adoption alongside delivery outcomes, including 63% inbox placement in its 2026 benchmark.
The 48% adoption figure counts tested domains; inbox placement concerns tested mail. These are different measurements within one report. Participation makes the panel relevant to tested senders, but does not establish representativeness of all active senders. The supplied evidence provides no domain sample count.
SimpleDMARC: 79.4% of 500 primary corporate domains. Its June 2026 Fortune Global 500 study used live DNS lookups on companies’ primary organizational domains. The result measures publication within that specific enterprise cohort.
The primary-domain restriction excludes any inference about complete corporate portfolios. The scan cannot establish equivalent coverage across subsidiaries, secondary brands, defensive registrations, or other unexamined domains.
ZNova: approximately 53.4% of 1,728 local-business domains. Its October 2026 small-business study reports that 46.6% lacked a DMARC record. Subtracting that absence rate from 100% yields approximately 53.4% record presence.
That calculated percentage measures publication, not successful message authentication. The local-business focus offers a segment-specific comparison, but not a representative national or global small-business rate. Averaging these five benchmarks would produce a number without a coherent denominator.
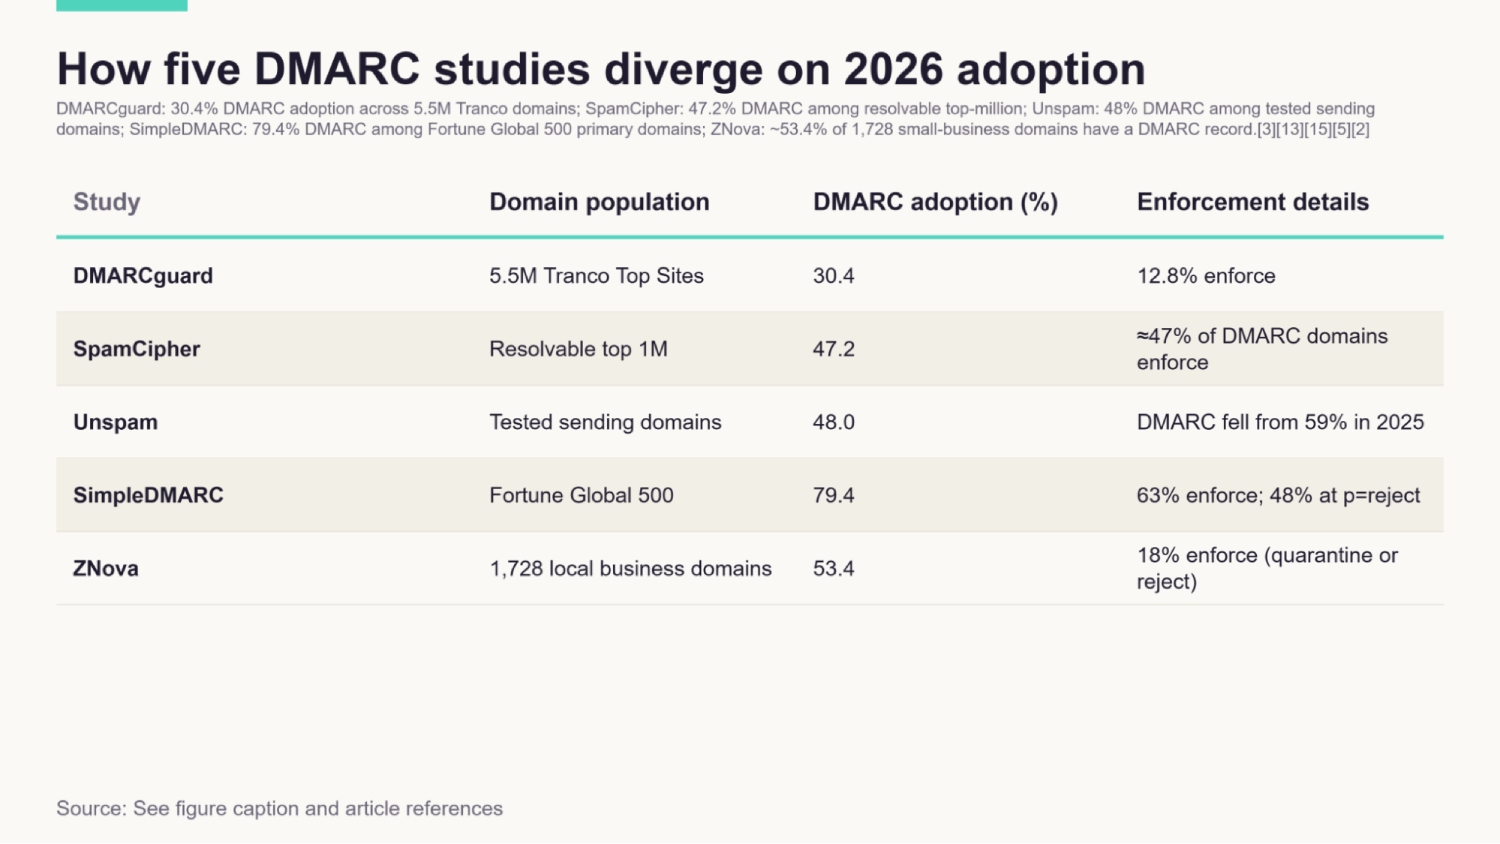
Comparison of DMARC adoption percentages across DMARCguard, SpamCipher, Unspam, SimpleDMARC, and ZNova studies, illustrating the effects of different denominators and sampling frames. Method: This table collates headline DMARC adoption figures from five 2026 studies, matching each percentage to its domain population and vantage point. DMARCguard and SpamCipher represent web-scale DNS scans; Unspam measures tested sending domains; SimpleDMARC focuses on Fortune Global 500 companies; ZNova examines local small-business domains.[3][13][15][5][2]
Before trusting a percentage, ask what was counted
The denominator determines what an authentication percentage means. Domains, companies, tested senders, and messages are different counting units, even when headlines call every result adoption.
Four questions distinguish the main measurements:
- Domains with records: What share of a defined list publishes authentication records?
- Tested sending domains: What share of domains participating in testing implements authentication?
- Companies’ primary domains: What share of selected organizations publishes authentication on its main domain?
- Messages passing authentication: What share of observed traffic passes the measured check?
Population boundaries matter even when two studies both count domains. DMARCguard’s February 2026 scan covers 5,499,028 domains drawn from the complete Tranco list. Its scope extends beyond the highest-ranked websites and is not restricted to confirmed senders.
SpamCipher’s 2026 analysis instead reports results for resolvable domains in Tranco’s top million. This popularity restriction changes the population. However, the supplied account also describes DMARCguard’s scan in terms of resolvable candidates. It therefore does not establish that different resolution exclusions explain their divergent results.
Popularity filters, DNS handling, and observation dates need explicit documentation. Establishing their effects would require matching domains, dates, and measurement rules across studies. The headline percentages alone cannot identify which factor matters most.
Sender panels introduce another selection step: domains must appear in the testing system. Unspam’s benchmark reports 48% DMARC adoption among tested sending domains in 2026. This does not describe every domain capable of sending email.
A sender-domain percentage also differs from a message pass rate. Counting domains gives each domain equal weight; counting messages gives frequent senders more influence. Neither can substitute for the other without changing the research question.
DKIM requires another distinction: limited detection does not establish absence. DKIM uses digital signatures to authenticate email. DMARCguard’s finding of at least 22.7% deployment is described as a conservative detection floor, not a complete prevalence estimate.
Unspam’s 90% DKIM figure concerns its tested sending-domain panel. The population and measurement context differ, so the figures do not establish comparable failure rates. In particular, subtracting a detection floor from 100% cannot reveal how many domains lack DKIM.
Non-sending domains should not be dismissed as irrelevant. They can still face impersonation attempts, even without legitimate outbound mail. Including them changes what a benchmark measures; it does not eliminate their security relevance.
Finally, company coverage is not portfolio coverage. A protected primary domain cannot stand in for every organizational domain. Keep the counting unit, population, exclusions, and observation date attached to each percentage.
A DMARC record is not an enforcement policy
Publishing DMARC and requesting enforcement are different milestones. A valid record may request no special handling for authentication failures.
Three mechanisms play distinct roles:
- SPF, or Sender Policy Framework, authorizes sending servers for a domain used during transmission.
- DKIM, or DomainKeys Identified Mail, provides a cryptographic signature verifiable through the signing domain’s public key.
- DMARC, or Domain-based Message Authentication, Reporting and Conformance, checks alignment with the visible From domain. It passes when at least one successful SPF or DKIM check uses an aligned domain.
Alignment connects the authenticated domain to the sender identity recipients see, under DMARC’s matching rules. Authentication of an unrelated domain alone does not satisfy that requirement.
DMARC’s policy tag specifies requested handling, not guaranteed delivery behavior:
p=nonerequests no special action based on DMARC failure. It supports monitoring when reporting is configured.p=quarantineasks receivers to treat failing messages as suspicious, commonly through spam-folder placement.p=rejectasks receivers to reject failing messages rather than accept them.
Receivers retain their own handling decisions and other security checks. Passing DMARC therefore does not guarantee inbox placement or establish that message content is trustworthy.
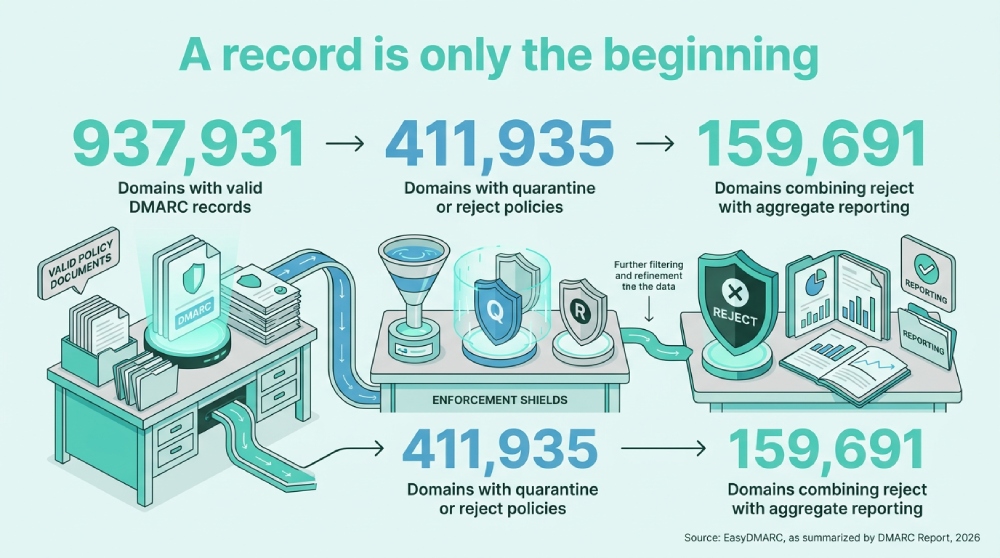
EasyDMARC’s 2026 top-1.8-million-domain panel illustrates the distinction, as summarized by DMARC Report. It reports 937,931 valid DMARC records, or 52.1% of all sampled domains.
The Expert Insights buyers’ guide separates that total into 29.2% monitoring-only and 22.9% enforcement, both using all sampled domains as the denominator. Enforcement means a quarantine or reject policy.
The infographic’s counts must be read as a total, two policy groups, and a narrower subset—not added together:
- 937,931 valid adopters: domains with valid monitoring or enforcement records.
- 525,996 monitoring-only domains: the difference between valid adopters and enforcing domains.
- 411,935 enforcing domains: domains requesting quarantine or rejection.
- 159,691 domains using reject plus RUA reporting: a subset of enforcing domains combining rejection with aggregate-report configuration.
Dividing 411,935 by 937,931 gives approximately 43.9%, or 44%, enforcement among valid adopters. Dividing the same enforcing count by the full panel gives approximately 22.9%. The first measures progress among adopters; the second measures coverage across the sampled population.
RUA specifies destinations for aggregate authentication reports. The reject-plus-RUA subset represents approximately 8.9% of the full panel, calculated from the reported count. This is a stricter configuration benchmark, not evidence that all other domains lack functioning enforcement.
RUA is not required for a reject policy to function. Conversely, configuring reporting does not establish that reports arrive, receive review, or lead to corrective action.
Monitoring-only records are not automatically misconfigured: they can validly request that policy. Enforcement also addresses domain impersonation, not every phishing technique. Neither publication nor enforcement should be reduced to a blanket claim of protection.
Source: EasyDMARC, as summarized by DMARC Report, 2026
Why authenticated traffic can coexist with unprotected domains
High message authentication rates can coexist with substantial gaps in domain coverage. The apparent contradiction disappears when messages observed and domains counted remain separate.
TechnologyChecker’s secondary summary of Cloudflare Radar supplies three outcomes: 88.99% DMARC pass, 4.33% fail, and 6.68% none. The supplied research assigns these figures to Q1 2026, but the source title says Q3 2026. That unresolved reporting-period conflict prevents a confident quarterly attribution.
The summary describes none as traffic whose sending domain published no DMARC policy. These percentages concern traffic observed by the measurement system, not every inbox or all global email. The original Radar methodology was not inspected for this article.
Weighting explains how traffic results can differ from domain adoption. Each observed message contributes to traffic statistics; each sampled domain contributes to a domain-level percentage. A prolific sender therefore has much more influence on the former.
By contrast, DMARCguard’s February 2026 scan reports DMARC records on 30.4% of 5,499,028 domains. A high-volume sender and a rarely used domain each contribute one domain to that calculation.
If authenticated senders generate disproportionate traffic, they can dominate message pass rates without increasing domain-level adoption. This is a plausible reconciliation, not a measured decomposition of the difference. The supplied evidence does not quantify sender contributions or separate volume concentration from population differences.
Accordingly, 6.68% none does not mean that only 6.68% of domains lack DMARC. Domains absent from observed traffic contribute nothing to that message-level percentage.
Unspam’s 2026 report provides another useful contrast: 93% SPF adoption, 90% DKIM adoption, 48% DMARC adoption, and 63% inbox placement. Its adoption figures describe tested sending domains, while placement measures delivery outcomes. These aggregates do not reveal what happened to the same individual messages.
Four questions should remain separate:
- Authentication success: Did an observed message pass the check being measured?
- Requested enforcement: Does the domain request quarantine or rejection when DMARC fails?
- Inbox placement: Did tested mail reach the inbox?
- Phishing risk: How much malicious or impersonating mail threatens recipients?
None of these benchmarks directly measures phishing risk or demonstrates its reduction. Strong authentication telemetry is informative within observed traffic, but cannot establish comprehensive domain coverage. Equally, low domain adoption does not mean that most received messages fail authentication.
Large companies and local businesses face different gaps
The enterprise–local-business contrast is strongest in enforcement, not merely record publication. Neither sample represents organizations generally, but their policy distributions reveal different deployment gaps.
SimpleDMARC’s June 2026 Fortune Global 500 study found records on 79.4% of primary domains. It reports 63% requesting quarantine or rejection and 48% requesting rejection specifically.
The 63% denominator is all 500 companies, equivalent to 315 companies—not only those with DMARC. Dividing 63 by 79.4 gives approximately 79.3% enforcement among record holders. That calculated percentage answers a different question and should not replace the all-company result.
ZNova’s October 2026 sample covered 1,728 local-business domains. It reports 46.6% without DMARC, implying approximately 53.4% record presence. Monitoring-only p=none accounts for 35.5% of all sampled domains.
The local-business policy shares are 10.9% quarantine and 6.9% reject. They sum to 17.8%, reasonably described as about 18% enforcement. The displayed categories total 99.9%, consistent with rounding.
Record presence differs between these samples by approximately 26 percentage points; enforcement differs by about 45. Within the sampled populations, enterprise primary domains more often publish DMARC and request action against failures. These remain configuration measurements, not observed rates of blocked attacks.
Population and collection differences limit the comparison. One panel covers major global companies’ primary domains; the other covers sampled local-business domains. Their different collection months add another source of variation. The gap is not a controlled estimate of company size’s effect.
Staffing is one plausible explanation, but the scans do not measure it. Dedicated specialists might have greater capacity to inventory senders, investigate failures, and prepare enforcement changes. Conversely, larger domain portfolios and more sending services could complicate enterprise deployment. Resources, complexity, and incentives remain hypotheses rather than demonstrated causes.
For supplier assessment, use these findings to improve questions—not assign risk automatically by business size:
- Scope: Which domains send invoices, account notices, and support messages?
- Policy: Which request monitoring, quarantine, or rejection?
- Ownership: Who maintains authentication and reviews reported failures?
- Coverage: Does the review include relevant subsidiaries and secondary brands?
- Evidence: When were domains checked, and what remains unexamined?
Check the domains actually used in your relationship. A large supplier’s primary-domain result cannot establish portfolio-wide protection. These benchmarks guide targeted investigation; they are not certificates of enterprise maturity or small-business weakness.
Source: SimpleDMARC and ZNova, 2026
Rising adoption and falling adoption can both be real
Rising and falling adoption can both be real when studies track different populations. Opposing 2026 trends do not establish a universal direction for all domains.
For a historical comparison against early 2026, EasyDMARC reports growth in its top-1.8-million-domain panel. Adoption rose from 29.1% in 2023 to 47.7% in 2025 and 52.1% in early 2026, according to the DMARC Report summary. The calculated increase from 2023 is 23 percentage points, not a doubling.
Unspam’s 2026 deliverability report presents the opposite historical comparison for tested senders. DMARC adoption fell from 59% in 2025 to 48% in 2026, while inbox placement rose from 49% to 63%.
These findings concern different populations. They do not show that the same domains simultaneously gained and lost coverage. Panel membership changes could contribute to the divergence, but the supplied evidence does not establish whether Unspam tested identical domains in both years. Deployment changes cannot therefore be cleanly separated from sampling changes.
Improved inbox placement also does not show that declining DMARC adoption helped delivery. The report provides aggregate movements, not a controlled test of their relationship. It does not establish whether domains lacking DMARC experienced the placement improvement.
Repeated observations offer a stronger basis for examining timing. In its historical comparison leading into 2026, the SpamCipher preprint reports deployment near 25–27% through January 2024, reaching 34.7% by July 2024. Its mid-2026 scan measured 47.2% among resolvable top-million domains.
That acceleration followed Google and Yahoo’s February 2024 bulk-sender requirements, discussed in the MarTech overview. The timing is consistent with requirements encouraging deployment. It does not isolate their causal effect from other contemporaneous changes.
Enforcement introduces a further distinction. SpamCipher reports approximately 47% of DMARC adopters requesting enforcement in 2023, with the share remaining near half through 2026. This is an adopter-based share, not an all-domain enforcement rate.
A stable enforcement share does not imply a stable enforcement count. If adopters increase while roughly half enforce, the enforcing count can also grow. This arithmetic neither identifies individual policy transitions nor proves that most new adopters remained monitoring-only.
The defensible conclusion is population-specific: popular-domain studies report growth toward 2026, while Unspam reports decline among tested senders. Explaining the divergence requires comparable samples, dates, and definitions—not an assumed universal trend.
Choose a benchmark you can explain to your board
Choose the benchmark that answers your board’s question, not the one with the most impressive percentage. A defensible comparison explains what was measured and where its relevance ends.
Before presenting an authentication statistic, complete this checklist:
- Population: Which domains or senders qualified for inclusion?
- Denominator: Does the percentage count all sampled domains, adopters, organizations, or messages? Record exclusions.
- Observation period: When was collection conducted? A 2026 title does not establish the measurement window.
- Method: Did researchers inspect DNS, test submitted mail, observe traffic, or collect survey responses?
- Definition: Does adoption mean record presence, validity, or requested enforcement? Track reporting separately.
- Provenance: Who collected the data, and does the original evidence support the quoted percentage?
Match the method to the decision. Use DNS scans for domain-portfolio questions, sender panels for comparisons among tested senders, and telemetry for observed message outcomes. None substitutes for the others simply because each mentions DMARC.
Source quality requires more than a working link. SpamCipher’s analysis is described as a preprint combining a review and active scan. Its status should remain explicit rather than being presented as established peer-reviewed evidence.
EasyDMARC’s findings appear here through secondary accounts, not its original report. The Expert Insights buyers’ guide preserves the top-1.8-million-domain population and separates valid records from enforcement. Its supplied publication metadata nevertheless predates the 2026 findings, leaving the update chronology unresolved.
Headlines require the same scrutiny as percentages. The DMARC Report summary frames a narrow measure as roughly 9% protected. The supplied breakdown ties that measure to rejection plus aggregate reporting—not all enforcement.
Some discrepancies require verification rather than statistical reconciliation. The supplied account of Axis Intelligence attributes 64% DMARC adoption to Unspam, whereas the supplied Unspam evidence reports 48%. This is an attribution discrepancy, not a demonstrated sampling difference. Its cause remains unknown.
Reporting-period conflicts also remain unresolved. The TechnologyChecker title specifies Q3 2026, while the research account assigns its Radar-derived figures to Q1 2026. The supplied publication date adds another inconsistency. Avoid presenting these figures as a settled quarterly comparison.
Unspam has separate report and statistics URLs in the source list. Its supplied report publication date also precedes an August 2026 observation claim in the research notes. Confirm the intended page, revision history, and collection window before making precise timing claims.
Finally, sample size cannot repair an unsuitable population. Confidence intervals quantify uncertainty under particular assumptions; they do not correct unrepresentative selection. A precise estimate for the wrong population still answers the wrong board question.
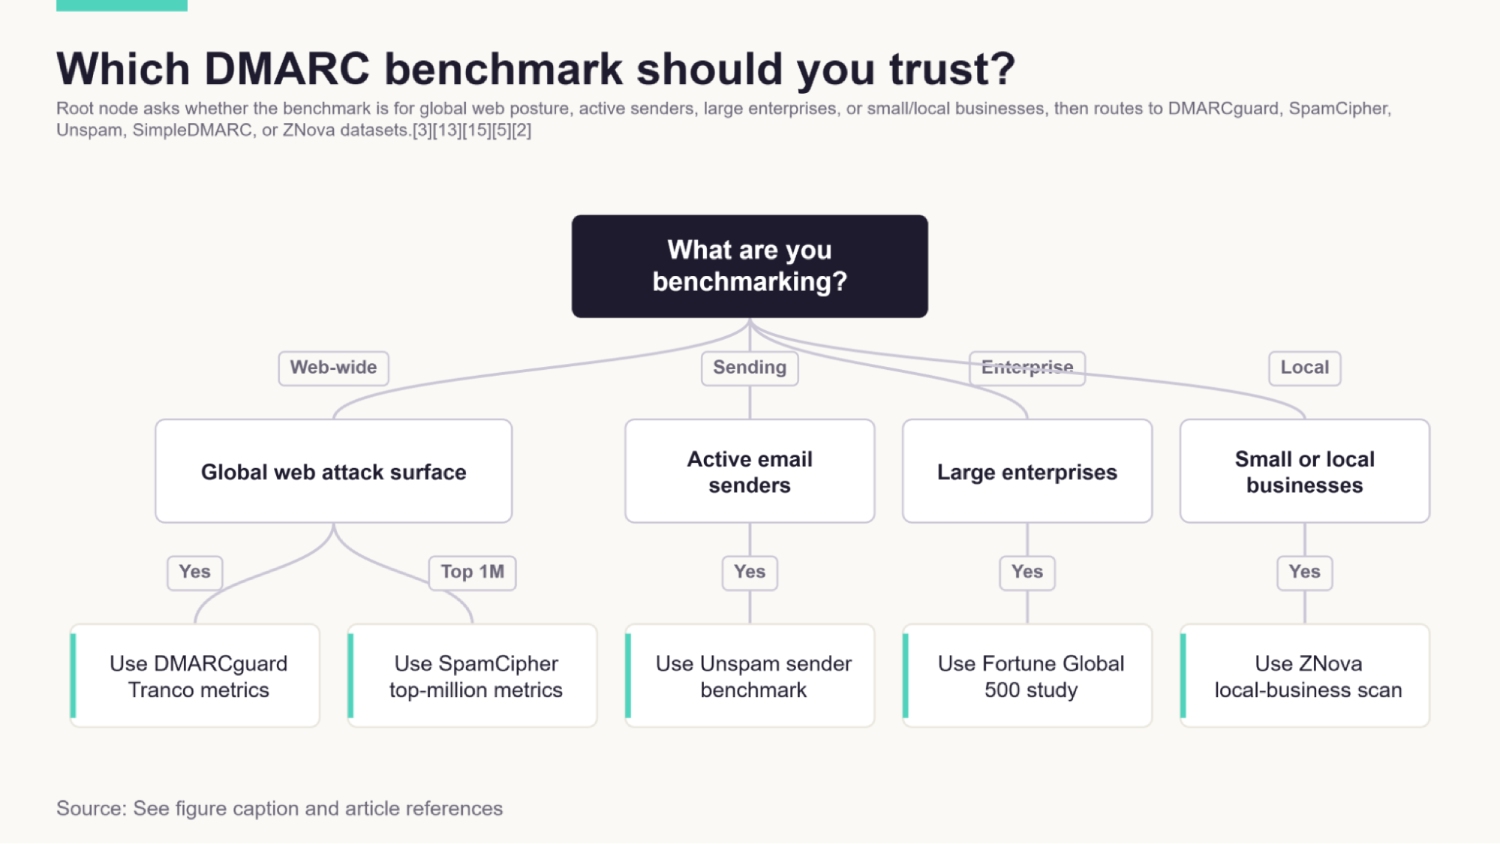
Decision tree guiding readers to the most relevant DMARC adoption benchmark based on whether they care about web-wide posture, active senders, large enterprises, or small businesses. Method: Nodes represent practical questions such as whether the reader’s concern is global attack surface, high-volume sending behaviour, or peer-group comparison. Branches map to DMARCguard, SpamCipher, Unspam, SimpleDMARC, or ZNova studies accordingly.[3][13][15][5][2]
Turn the numbers into a better authentication program
Build your measurement plan around your domains and legitimate mail, not a headline adoption rate. The goal is stronger protection without disrupting services your organization uses.
Start with an inventory of sending and non-sending domains, including parked names and relevant subdomains. Assign owners, document intended use, and identify approved sending services. Investigate unknown senders rather than assuming they are legitimate or malicious.
Maintain four separate measures, each with a numerator, denominator, and observation date. The distinction between valid records and enforcement follows the categories in the DMARC buyers’ guide; the operational dashboard below is a recommendation, not a tested intervention.
- Valid records: Measure domains with valid DMARC records against the inventoried population. Track SPF and DKIM configuration checks separately for identified sending services.
- Requested enforcement: Count quarantine and reject policies separately from monitoring-only policies. Preserve policy details instead of assigning a single protected or unprotected label.
- Aggregate reporting: Distinguish configured reporting from reports actually received and reviewed. Treat review and remediation as operational tasks, not configuration checkboxes.
- Legitimate-message authentication: Measure results for identified legitimate traffic over a defined period. Break failures down by service and domain so large senders do not obscure smaller services’ problems.
These measures are complementary, not ingredients for one maturity percentage. Domain coverage describes deployment breadth; legitimate-message results describe observed performance within assessable traffic. Neither establishes protection beyond its scope.
Keep inbox placement separate. Unspam’s report places adoption and delivery results alongside one another, but does not establish a causal relationship. Track delivery outcomes independently rather than treating an authentication pass as proof of inbox arrival.
Before tightening policy, investigate legitimate-mail failures and document unresolved issues. Correct configurations, validate affected services, and stage changes with clear ownership and a rollback plan. Enforcement should follow evidence of readiness, not pressure to improve a dashboard score.
Buyers can turn these recommendations into concrete evaluation questions:
- How does the tool discover senders and help distinguish approved services from unknown activity?
- How does it explain authentication failures, aggregate reports, and visibility gaps?
- Can teams assess sending and non-sending domains while retaining domain-level detail?
- How are policy changes reviewed, staged, audited, and reversed when legitimate mail is affected?
Ask vendors to demonstrate answers using representative domains and sending services. Feature labels alone do not establish operational capability.
The 2026 benchmarks are most useful as prompts for investigation. Peer performance is context, not a protection ceiling or universal success threshold. Set priorities around your domain inventory, legitimate sending needs, and unresolved risks.
Limitations
- This article synthesizes supplied research summaries. Underlying datasets and original source text were not independently inspected.
- Some publication dates, reporting periods, and source titles conflict. Precise timing remains uncertain where those conflicts cannot be resolved.
- Vendor studies, a preprint, and secondary summaries have different evidential strengths. None establishes a representative global adoption rate.
- Domain scans measure published configurations, not receiver behavior, reporting quality, portfolio-wide protection, or reductions in spoofing.
- Cross-study comparisons cannot isolate the effects of organization size, sampling changes, or sender requirements without comparable populations and methods.
References
- DMARC for Small Business: Data Collected From 1,728 Domains | ZNova
- DMARC Adoption Statistics 2026: Fortune Global 500
- Why email is now identity and deliverability infrastructure | MarTech
- Email Marketing Statistics 2026: ROI, Open Rates, Automation …
- PDF Email Authentication at Scale: A Systematic Review and 2026 …
- 2026 Email Deliverability Report: Benchmark Data vs 2025
- DMARC Buyers’ Guide 2026 - Expert Insights
- DMARC Adoption Statistics Q3 2026: 89% Pass, About 1 in …
- The State of DMARC Adoption in 2026:938000 Domains Have …
- DMARC Adoption 2026: 30.4%, DKIM 22.7% of 5.5M - DMARCguard
General Manager
General Manager of DuoCircle. Product strategy and commercial lead for DMARC Report's 2,000+ customer base.
LinkedIn Profile →Take control of your DMARC reports
Turn raw XML into actionable dashboards. Start free - no credit card required.